
THERE are nine Covid hotspots in Oxford as cases in the city continue to rise.
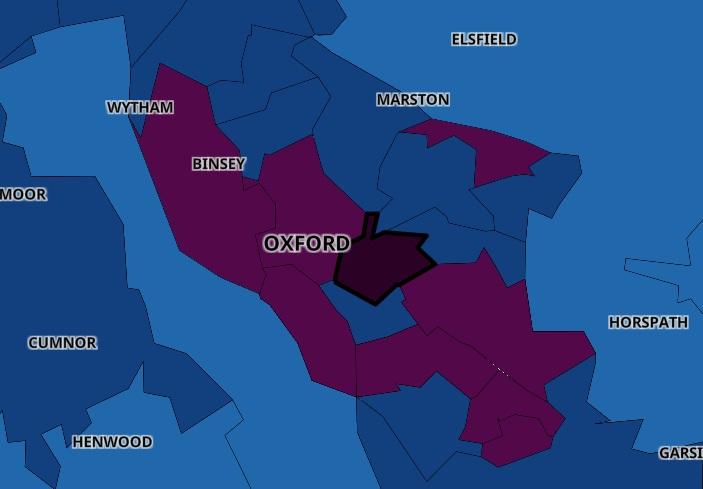
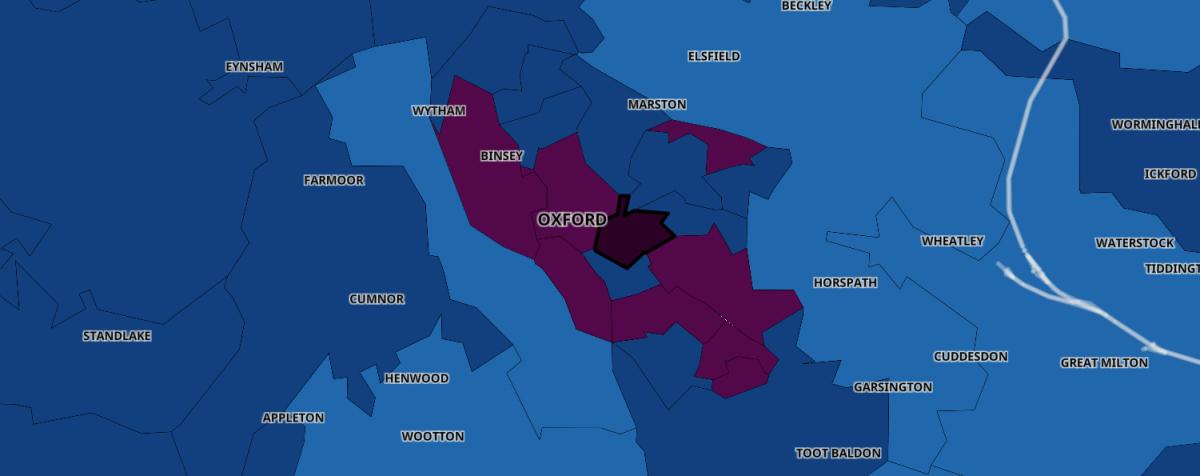
Data revealed in an interactive map published by the Government shows the seven-day case rate per 100,000 people for the period ending on July 8.
Here's a list of the places in Oxford that have a Covid case rate per 100,000 people of more than 400:

- East Central Oxford 820.5
- Oxford Central 786.2
- Osney, Jericho and Port Meadow 657.6
- Cowley North 521.2
- Cowley South & Iffley 502.1
- Barton 490.5
- Grandpont & New Hinksey 488.8
- Greater Leys 402.2
- Blackbird Leys 402.0
Keep up to date with all the latest news on our website, or follow us on Facebook, Twitter and Instagram.
For news updates straight to your inbox, sign up to our newsletter here.
Have you got a story for us? Contact our newsdesk on news@nqo.com or 01865 425 445.


Comments: Our rules
We want our comments to be a lively and valuable part of our community - a place where readers can debate and engage with the most important local issues. The ability to comment on our stories is a privilege, not a right, however, and that privilege may be withdrawn if it is abused or misused.
Please report any comments that break our rules.
Read the rules hereLast Updated:
Report this comment Cancel