

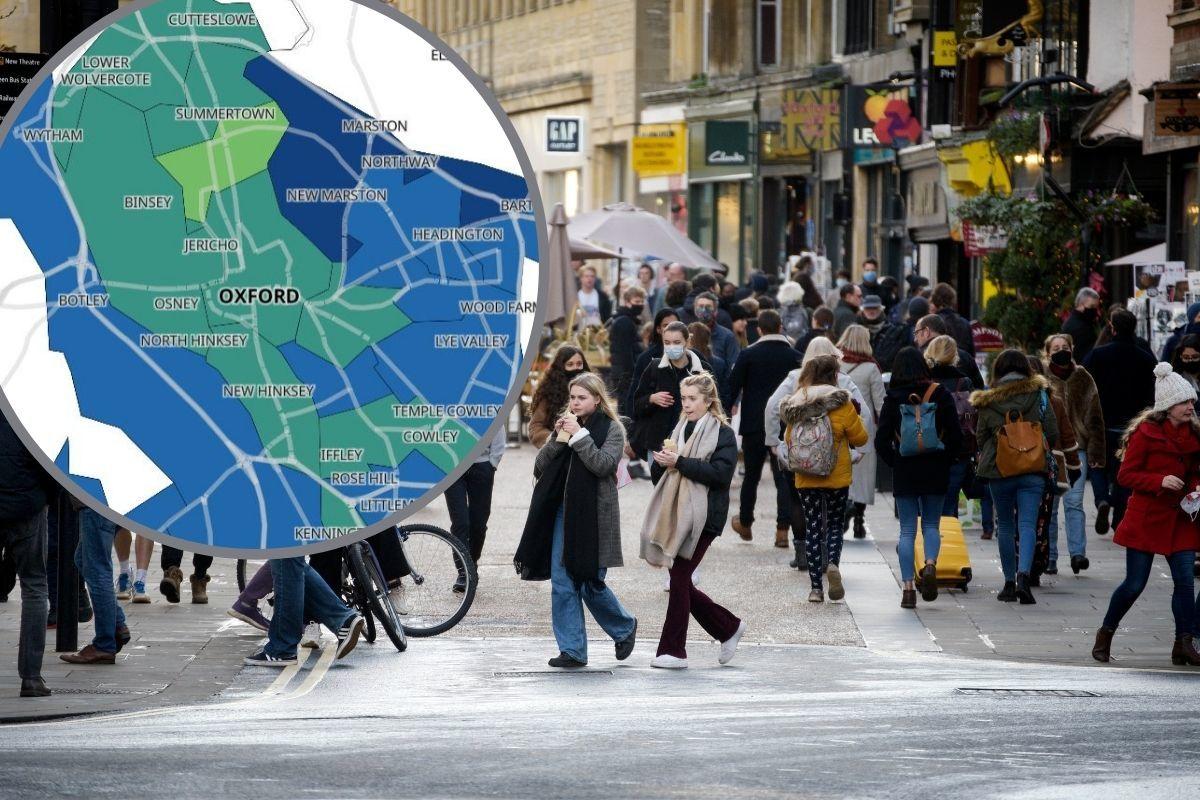
The difference lockdown has made to Covid cases across Oxford can be seen in an interactive map.
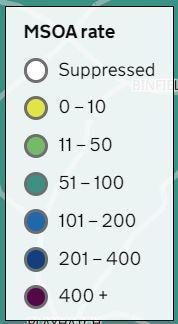
Going from light green through to dark blue, the Public Health England map shows areas with the highest weekly infection rates per 100,000 people.

Map of Oxford Covid cases in the week to December 1
While cases have not come down in every area of the city, which is divided into 18 wards of roughly equal population size, some hotspots have dropped sharply during the month.
As the city headed into national restrictions Cowley North recorded 43 cases in the week to November 3, but this has halved to 21. Other successes include East Central Oxford down to six as of December 1 from 34.
At the opposite end, however, Greater Leys, had 18 infections to December 1 compared with just three at the start of November.
These are, from left, the current new weekly cases to December 1, in brackets the change from the week before, and by comparison the number of weekly cases to November 3.
- Oxford Central – 16 (down six), 11
- Headington – 22 (down 16), 24
- East Central Oxford – Six (up one), 34
- Cowley North – 21 (up five), 43
- Churchill – 14 (down one), nine
- North Central Oxford – Three (down six), six
- Risinghurst & Sandhills – Eight (down seven), 10
- Cowley South & Iffley – Six (down one), 17
- Osney, Jericho & Port Meadow - Four, (down four), three
- Iffley Fields – Six, (same), 16
- Blackbird Leys – 18 (up two), 13
- Greater Leys – 18 (up three), three
- Wolvercote & Cutteslowe – Three (down four), six
- Littlemore & Rose Hill – 10 (down one) 22
- Summertown – Four (up two), three
- Marston – 17 (up six), eight
- Barton – 15 (up six), nine
- Grandpont & New Hinksey – Four (up two), five

Comments: Our rules
We want our comments to be a lively and valuable part of our community - a place where readers can debate and engage with the most important local issues. The ability to comment on our stories is a privilege, not a right, however, and that privilege may be withdrawn if it is abused or misused.
Please report any comments that break our rules.
Read the rules here