

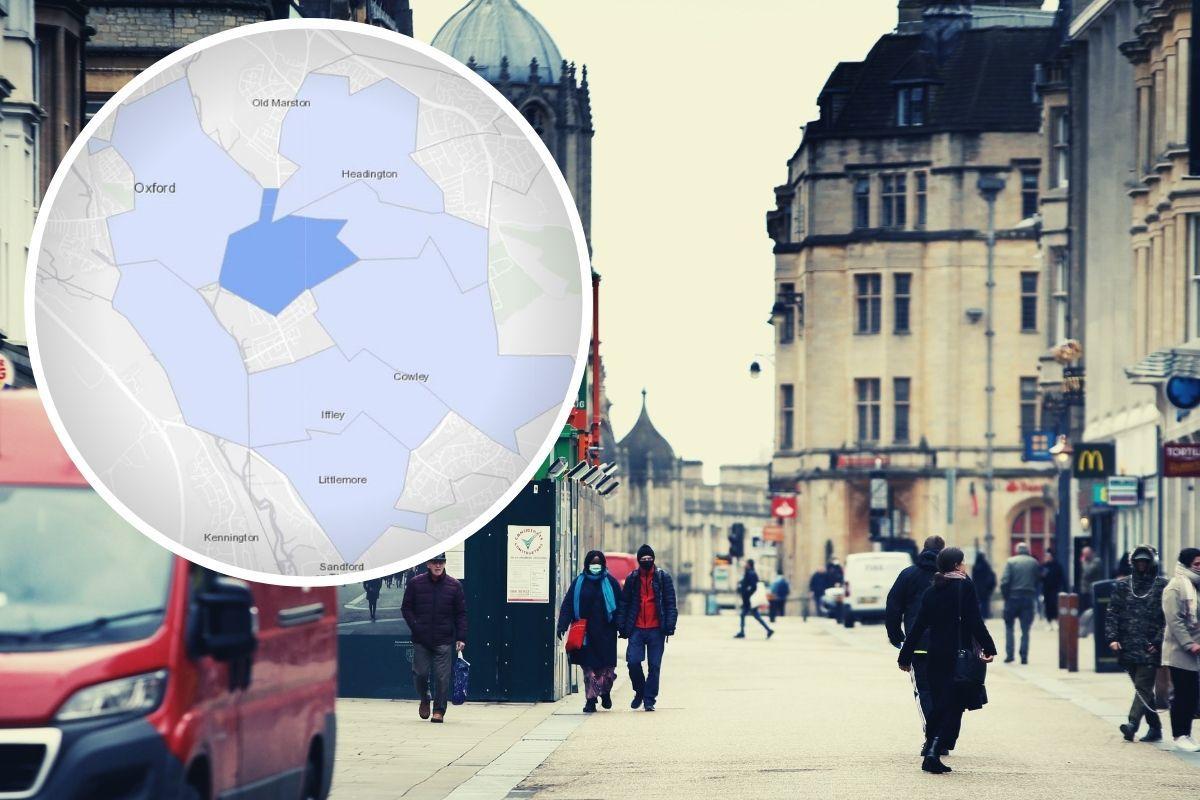
The parts of Oxford currently worst impacted by Covid cases can be seen in an online map.
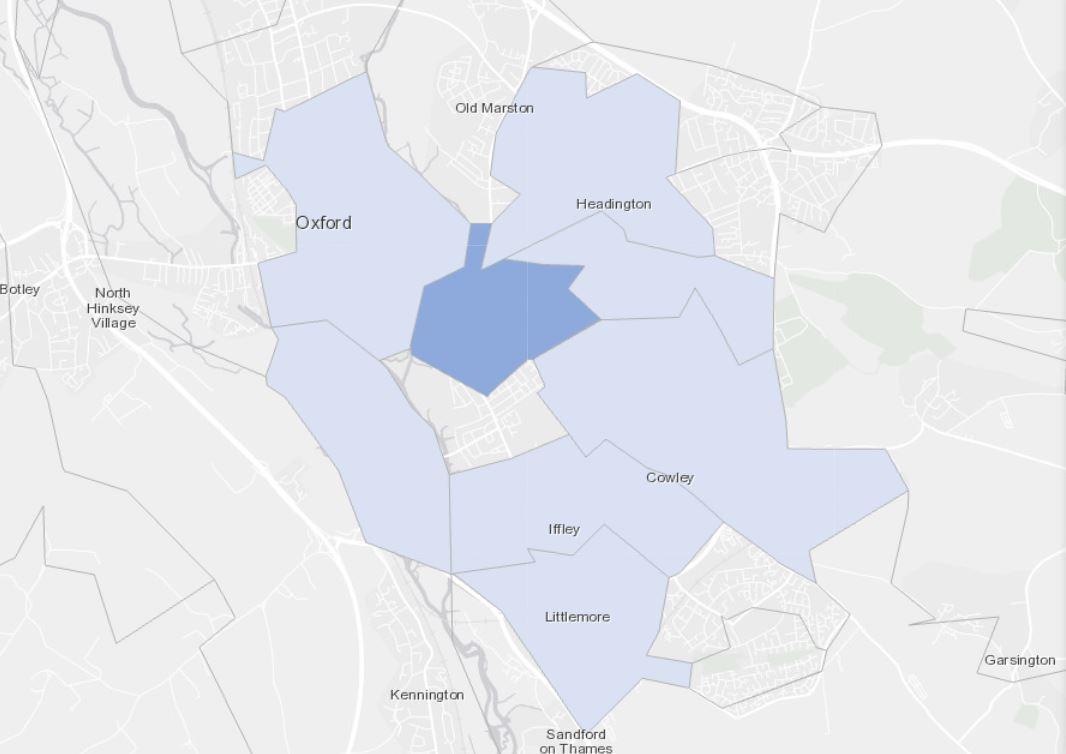
The interactive data, which is part of the Government’s coronavirus dashboard, shows where positive cases have been concentrated in recent days across 18 areas.
Each has a population of approximately 7,200 people.
ALSO READ: I have to self-isolate in Oxford – what help is there?
It is based on pillar 1 and pillar 2 testing data, which covers tests carried out by commercial partners and those analysed in NHS or Public Health England laboratories England, and is for the period of September 21-27.
The delay is to allow for a more complete picture of total case numbers.
In Oxford, the most cases during this period were in East Central Oxford, which had more than 20 positive tests over the seven days.
It reflects the increase in positive tests in the city,which has been linked to young adults, and shows cases are spread throughout Oxford.
Last week, the majority of cases were Cowley North, which had seven positive tests, with all areas with more than two cases in nearby parts of the city.
The full current list;
- East Central Oxford 22
- Churchill 9
- Headington 7
- Oxford Central 7
- Cowley North 7
- Cowley South & Iffley 4
- Littlemore & Rose Hill 3
- Grandpont & New Hinksey 3
Other areas in the city such as Summertown, Iffley Fields, and Marston have recorded between none and two cases.
Small cases are grouped and not individually identified.
Across the county the other areas with more than two cases during this period are;
- South Wantage, Harwell & Blewbury 7
- Islip, Arncott & Chesterton 3
- Woodstock, Stonesfield & Tackley 3
- Burford & Brize Norton 3
- Kingston Bagpuize & East Hanney 3


Comments: Our rules
We want our comments to be a lively and valuable part of our community - a place where readers can debate and engage with the most important local issues. The ability to comment on our stories is a privilege, not a right, however, and that privilege may be withdrawn if it is abused or misused.
Please report any comments that break our rules.
Read the rules hereLast Updated:
Report this comment Cancel