

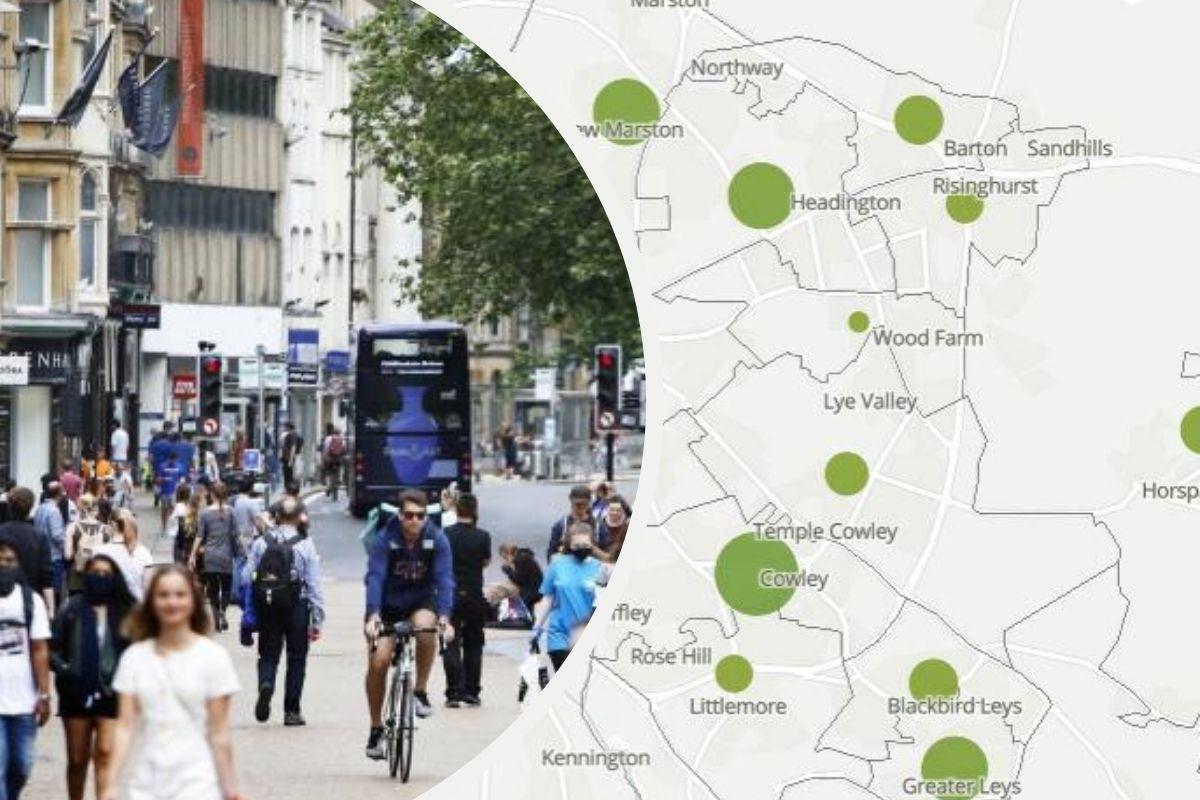
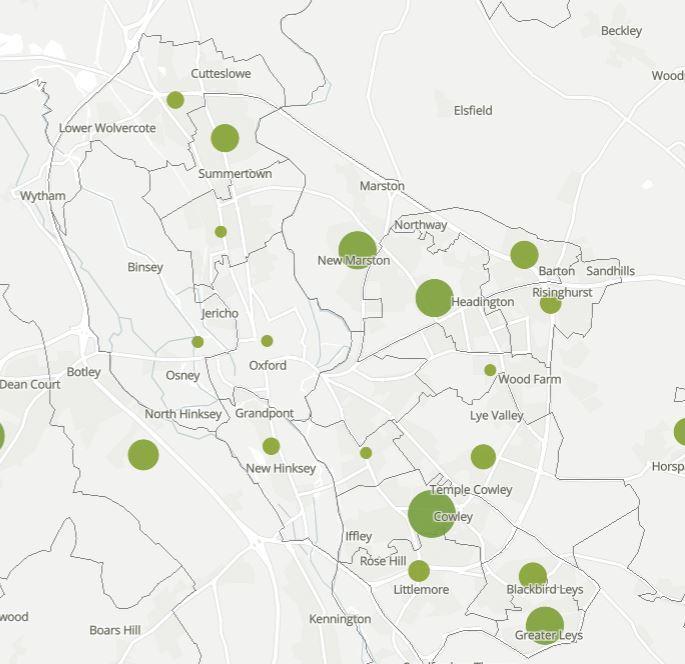
THE hotspots for coronavirus deaths in Oxfordshire have been revealed in a searchable map.
Updated interactive data from the Office for National Statistics (ONS) includes all deaths where Covid-19 was the underlying cause, or was mentioned on the death certificate as a contributory factor, between March 1 and June 30.
In Oxford, Cowley South and Iffley has remained the ward with the most deaths of the city’s 18 areas, with 14 people dying with the virus, including three in June.
It accounts for 60 per cent of June’s five coronavirus deaths in the city, with a single death in Risinghurst and Sandhills and one in Greater Leys.
Also read: Latest coronavirus infection rate for Oxford
The ONS data also reveals since the start of the pandemic 75 people have died in the city with the virus noted on their death certificate out of a total of 311 fatalities.
It means between March and June almost one in four deaths (24 per cent) were down, at least in part, to coronavirus.
The impact has varied across the city though with Cowley South and Iffley having 35 per cent of deaths (14 out of 40) coronavirus related compared with North Central Oxford which only had one death out of 19 connected to the virus.
Following a trend highlighted last month, the Cowley South ward also contains one of the most deprived parts of the county –Rose Hill and Iffley, judged by factors such as income, employment, health, education and crime.
Oxford MPs, councillors and health officials have all previously raised concerns coronavirus has exposed existing health inequalities.
This is also replicated nationally, with the mortality rate in England's most deprived areas more than double than in the least deprived.
Read again: Coronavirus deaths by area expose Oxford health inequality
A Department of Health and Social Care spokesman said the disparity highlighted by the new ONS data was greater than inequality seen in previous years.
He added: “We are committing to better understanding and reducing the disparity in health outcomes – in the context of coronavirus and more broadly."
Also highlighted in the ONS map was that for the vast majority of the county virus deaths spiked sharply in April, suggesting outbreaks were brought quickly under control.
These include previous hotspots such as Abingdon Town and West which had 20 deaths overall, 17 of these in April.
Also read: Oxford coronavirus test gives results in 90 minutes
Separate ONS analysis shows Oxfordshire experienced more than twice as many deaths as normal during the worst period of the coronavirus crisis.
The number of excess deaths in the county hit a peak in the week ending April 17, with 141 per cent more deaths than the average for the previous five years.


Comments: Our rules
We want our comments to be a lively and valuable part of our community - a place where readers can debate and engage with the most important local issues. The ability to comment on our stories is a privilege, not a right, however, and that privilege may be withdrawn if it is abused or misused.
Please report any comments that break our rules.
Read the rules hereLast Updated:
Report this comment Cancel